Centennial
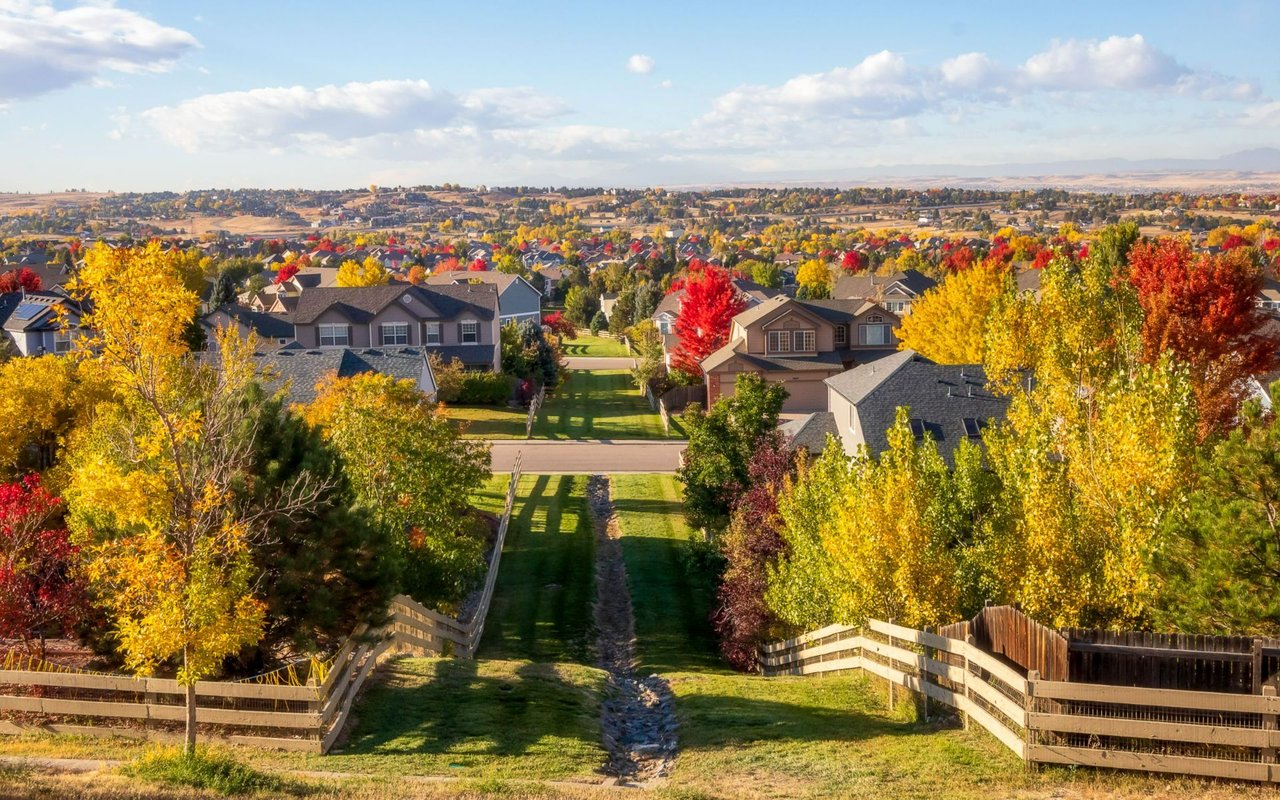
Stretches across a significant suburban area, offering a wealth of attractions and amenities for residents and visitors alike.
If you're seeking a suburban retreat that combines modern conveniences with a touch of mid-century elegance, look no further than Centennial, Colorado. Explore its diverse neighborhoods, discover its hidden gems, and find your perfect home amidst the tranquil streets and architectural marvels of this vibrant community. Welcome to Centennial: where suburban living meets mid-century charm, and every day brings new opportunities for adventure and discovery.
107,386 people live in Centennial, where the median age is 41.8 and the average individual income is $63,885. Data provided by the U.S. Census Bureau.
Total Population
Median Age
Population Density
Average individual Income
There's plenty to do around Centennial, including shopping, dining, nightlife, parks, and more. Data provided by Walk Score and Yelp.
Explore popular things to do in the area, including Arapaho Park, Denver Pain & Performance, and Gloria Davis - Magnolia Salon.
| Name | Category | Distance | Reviews |
Ratings by
Yelp
|
|---|---|---|---|---|
| Active | 4.71 miles | 5 reviews | 5/5 stars | |
| Active | 3.57 miles | 19 reviews | 5/5 stars | |
| Beauty | 2.13 miles | 5 reviews | 5/5 stars | |
| Beauty | 4.78 miles | 5 reviews | 5/5 stars | |
| Beauty | 0.92 miles | 65 reviews | 5/5 stars | |
| Beauty | 4.35 miles | 9 reviews | 5/5 stars | |
| Beauty | 1.69 miles | 5 reviews | 4.8/5 stars | |
| Beauty | 4.09 miles | 42 reviews | 4.8/5 stars | |
| Beauty | 2.45 miles | 4 reviews | 5/5 stars | |
| Beauty | 2.56 miles | 4 reviews | 5/5 stars | |
|
|
||||
|
|
||||
|
|
||||
|
|
||||
|
|
||||
|
|
Centennial has 41,518 households, with an average household size of 2.55. Data provided by the U.S. Census Bureau. Here’s what the people living in Centennial do for work — and how long it takes them to get there. Data provided by the U.S. Census Bureau. 107,386 people call Centennial home. The population density is 3,613 and the largest age group is Data provided by the U.S. Census Bureau.
Total Population
Population Density Population Density This is the number of people per square mile in a neighborhood.
Median Age
Men vs Women
Population by Age Group
0-9 Years
10-17 Years
18-24 Years
25-64 Years
65-74 Years
75+ Years
Education Level
Total Households
Average Household Size
Average individual Income
Households with Children
With Children:
Without Children:
Blue vs White Collar Workers
Blue Collar:
White Collar:

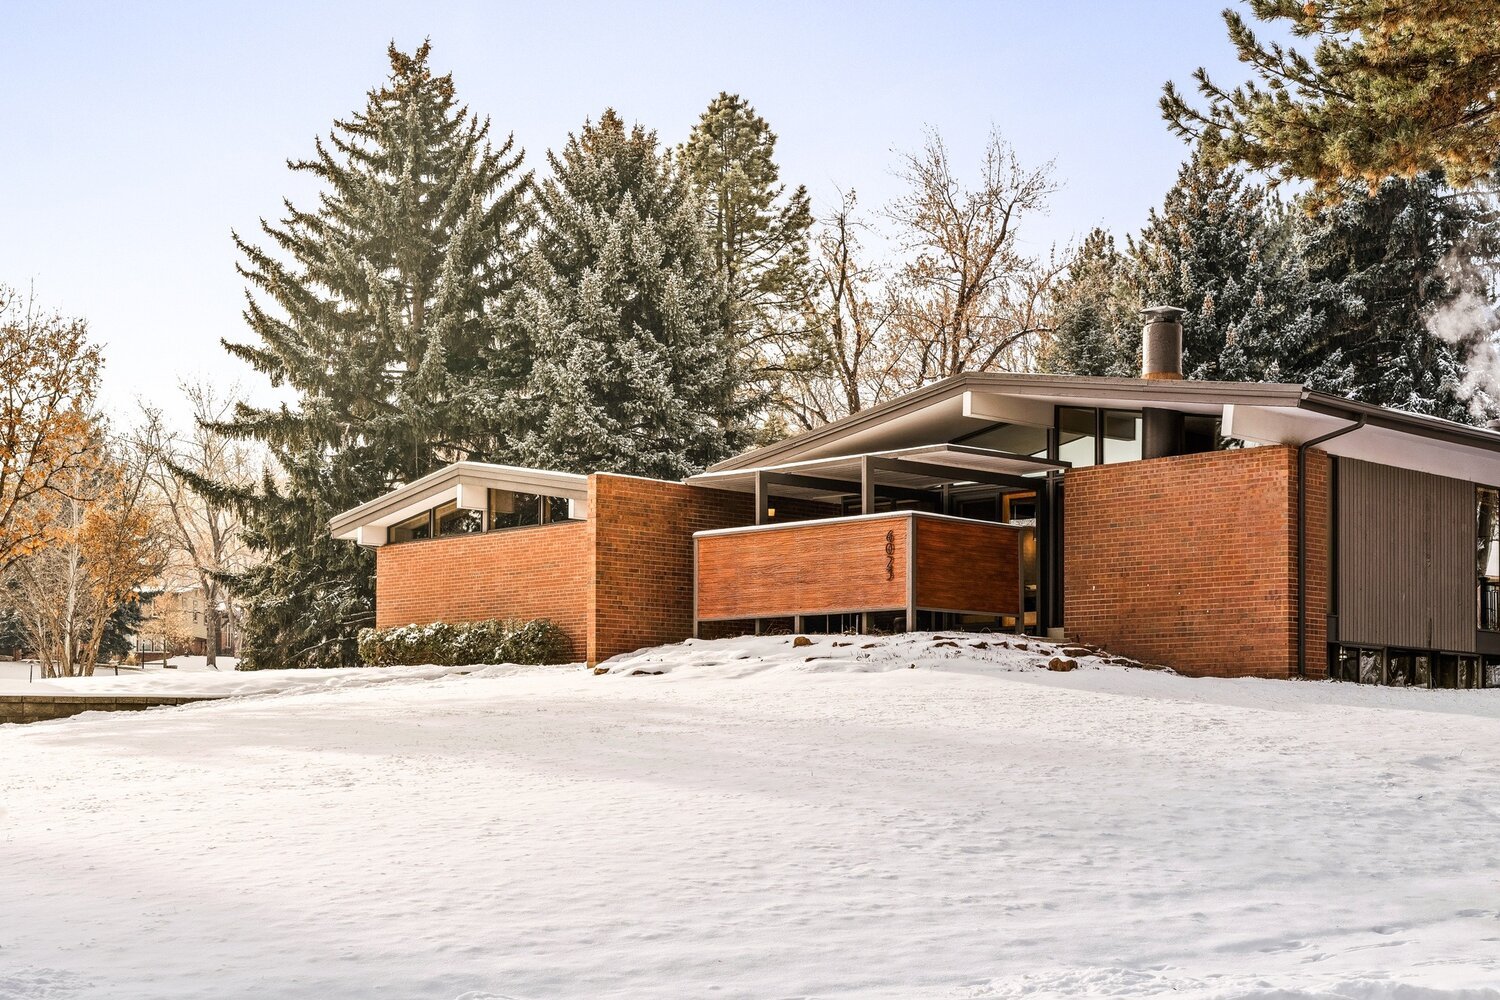
Mid-Century Modern Dream Homes
M: 303.345.5886
O: 303.536.1786
[email protected]
200 Columbine St Ste 400
Denver CO 80206
Mid-Century Modern Dream Homes
M: 303.345.5886
O: 303.536.1786
[email protected]
200 Columbine St Ste 400
Denver CO 80206